
Live dashboard
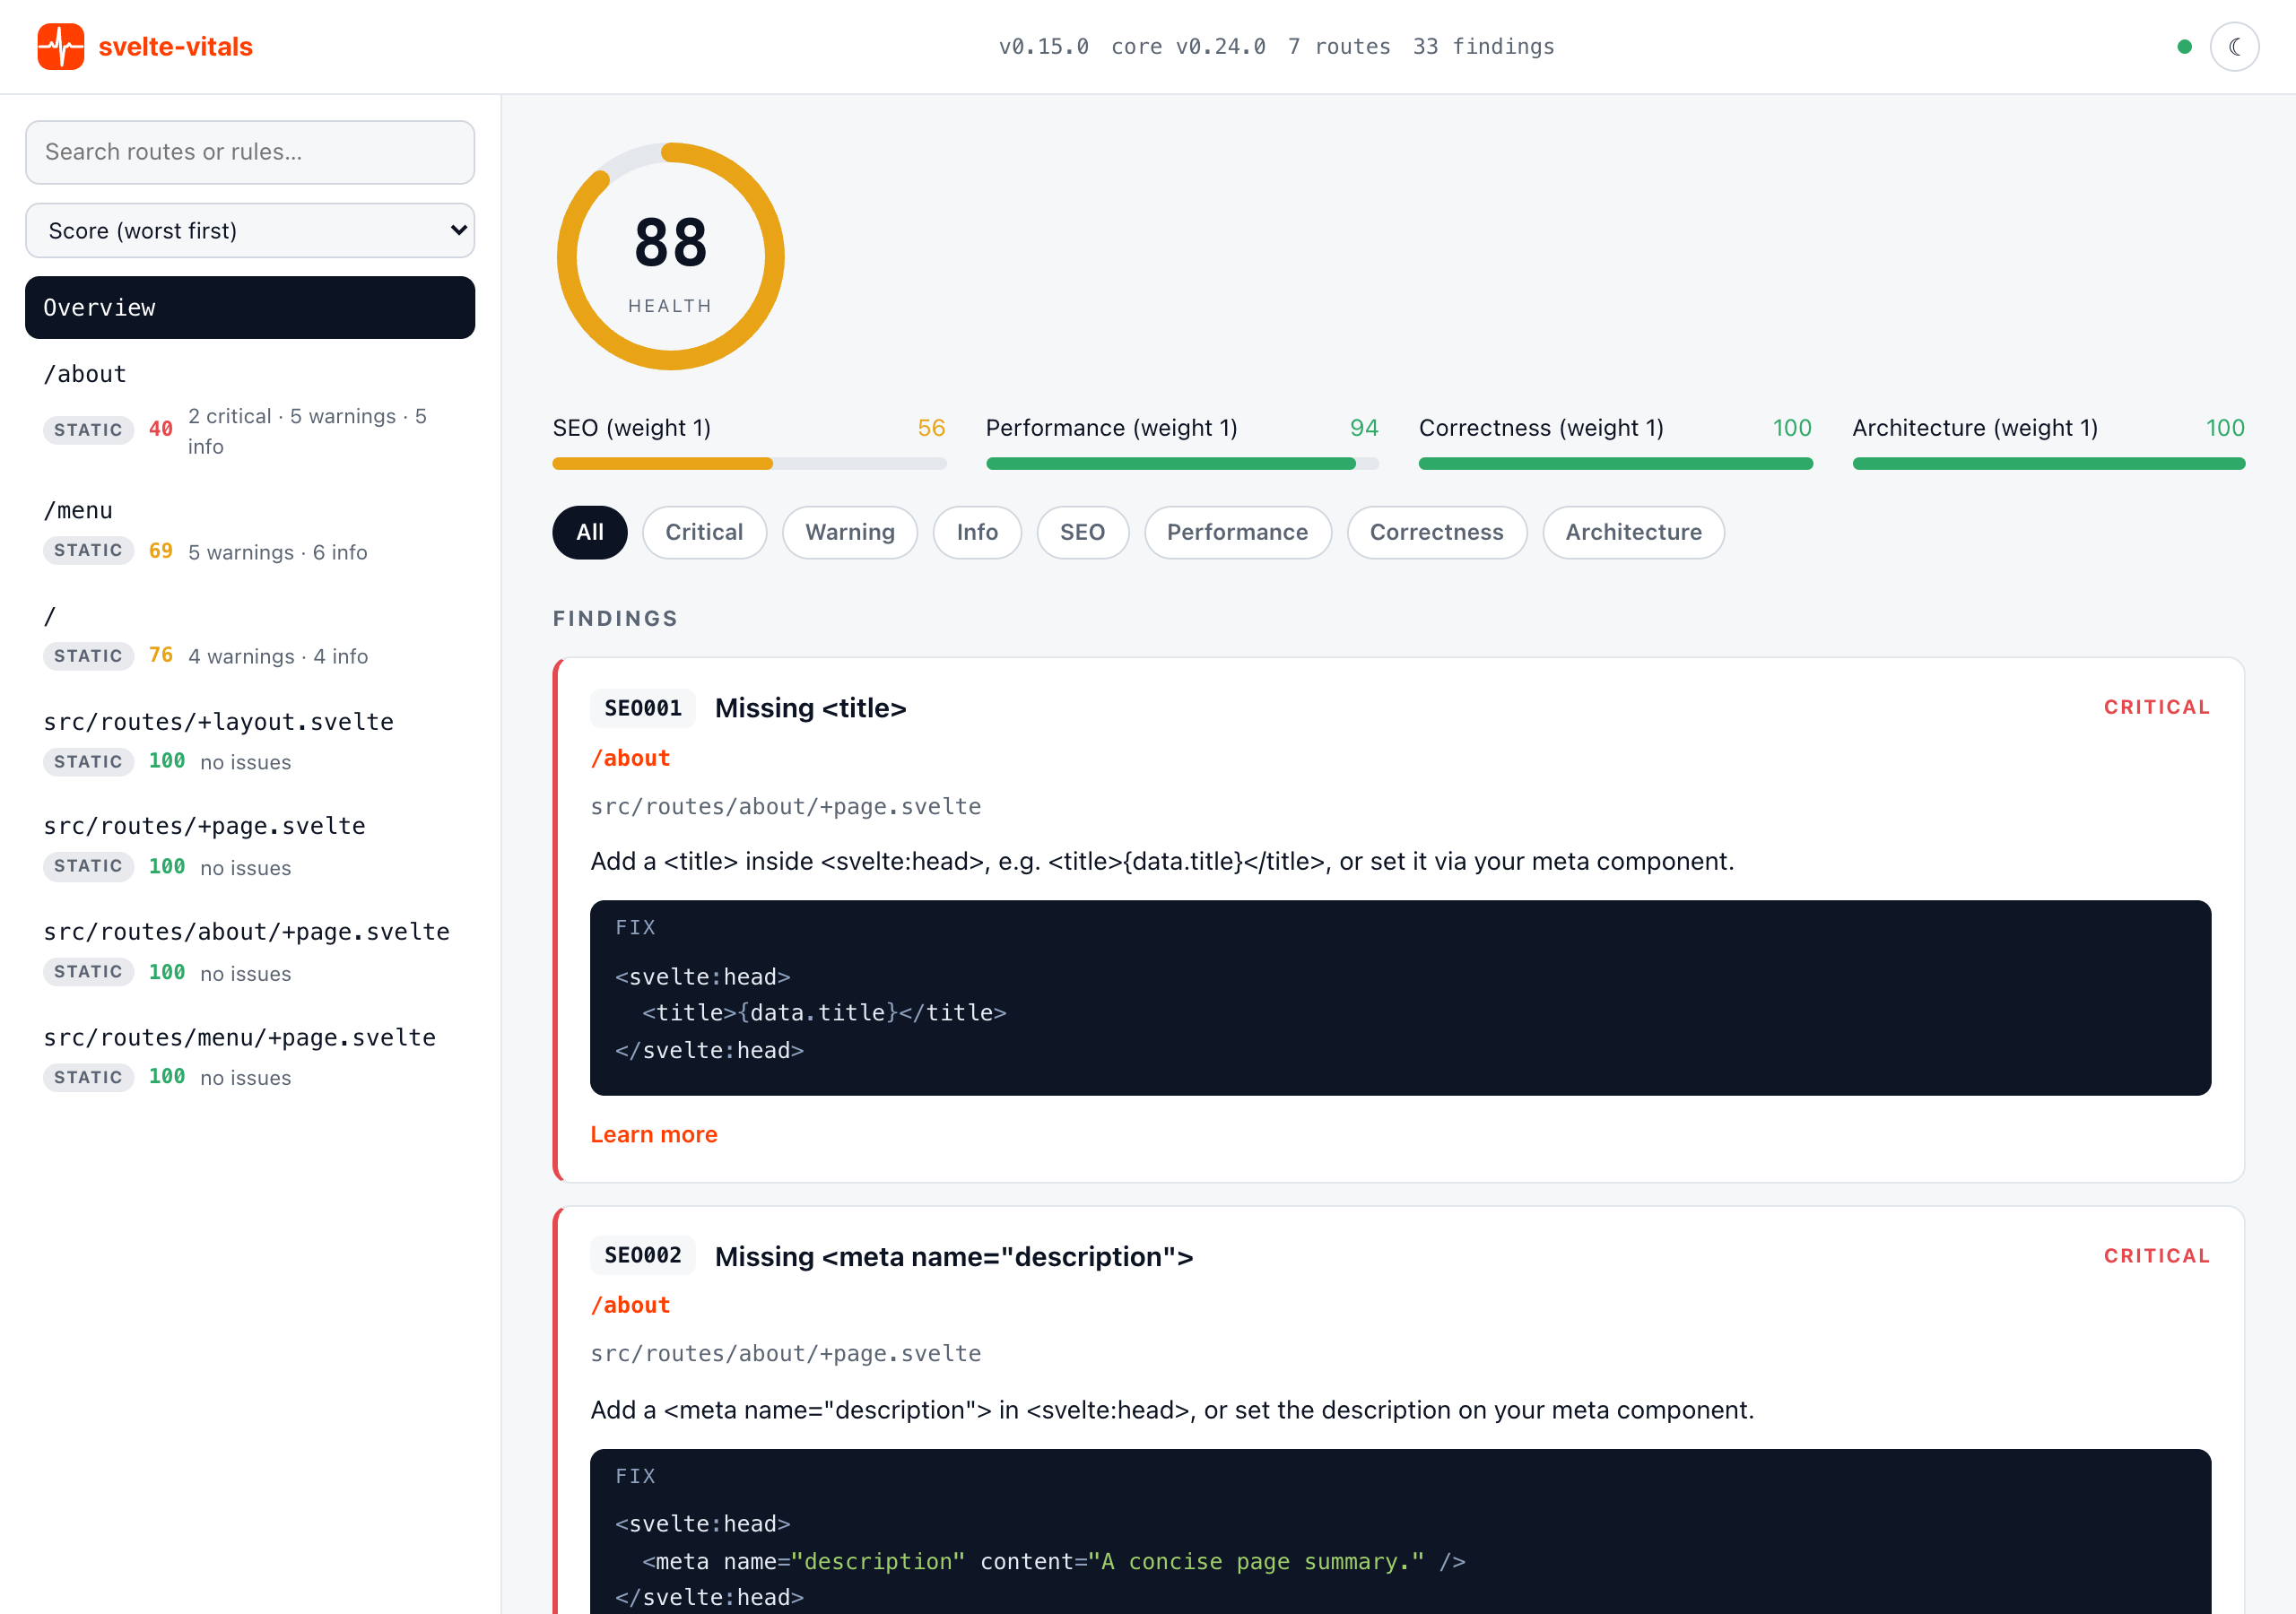
@svelte-vitals/vite’s svelteVitals() plugin serves a live dashboard at /__svelte-vitals/ during vite dev — a searchable, sortable route list with a detail pane for the selected route, or an “Overview” that aggregates every finding across the whole project. It updates in place as you work, and it’s on by default; see Disabling it to opt out.
// vite.config.{js,ts}import { svelteVitals } from '@svelte-vitals/vite';
export default {  plugins: [svelteVitals() /* , sveltekit() */]};
vite dev prints the dashboard’s URL right after its own Local:/Network: lines every time the server starts, so you don’t have to remember the /__svelte-vitals/ path:
➜ svelte-vitals: http://localhost:5173/__svelte-vitals/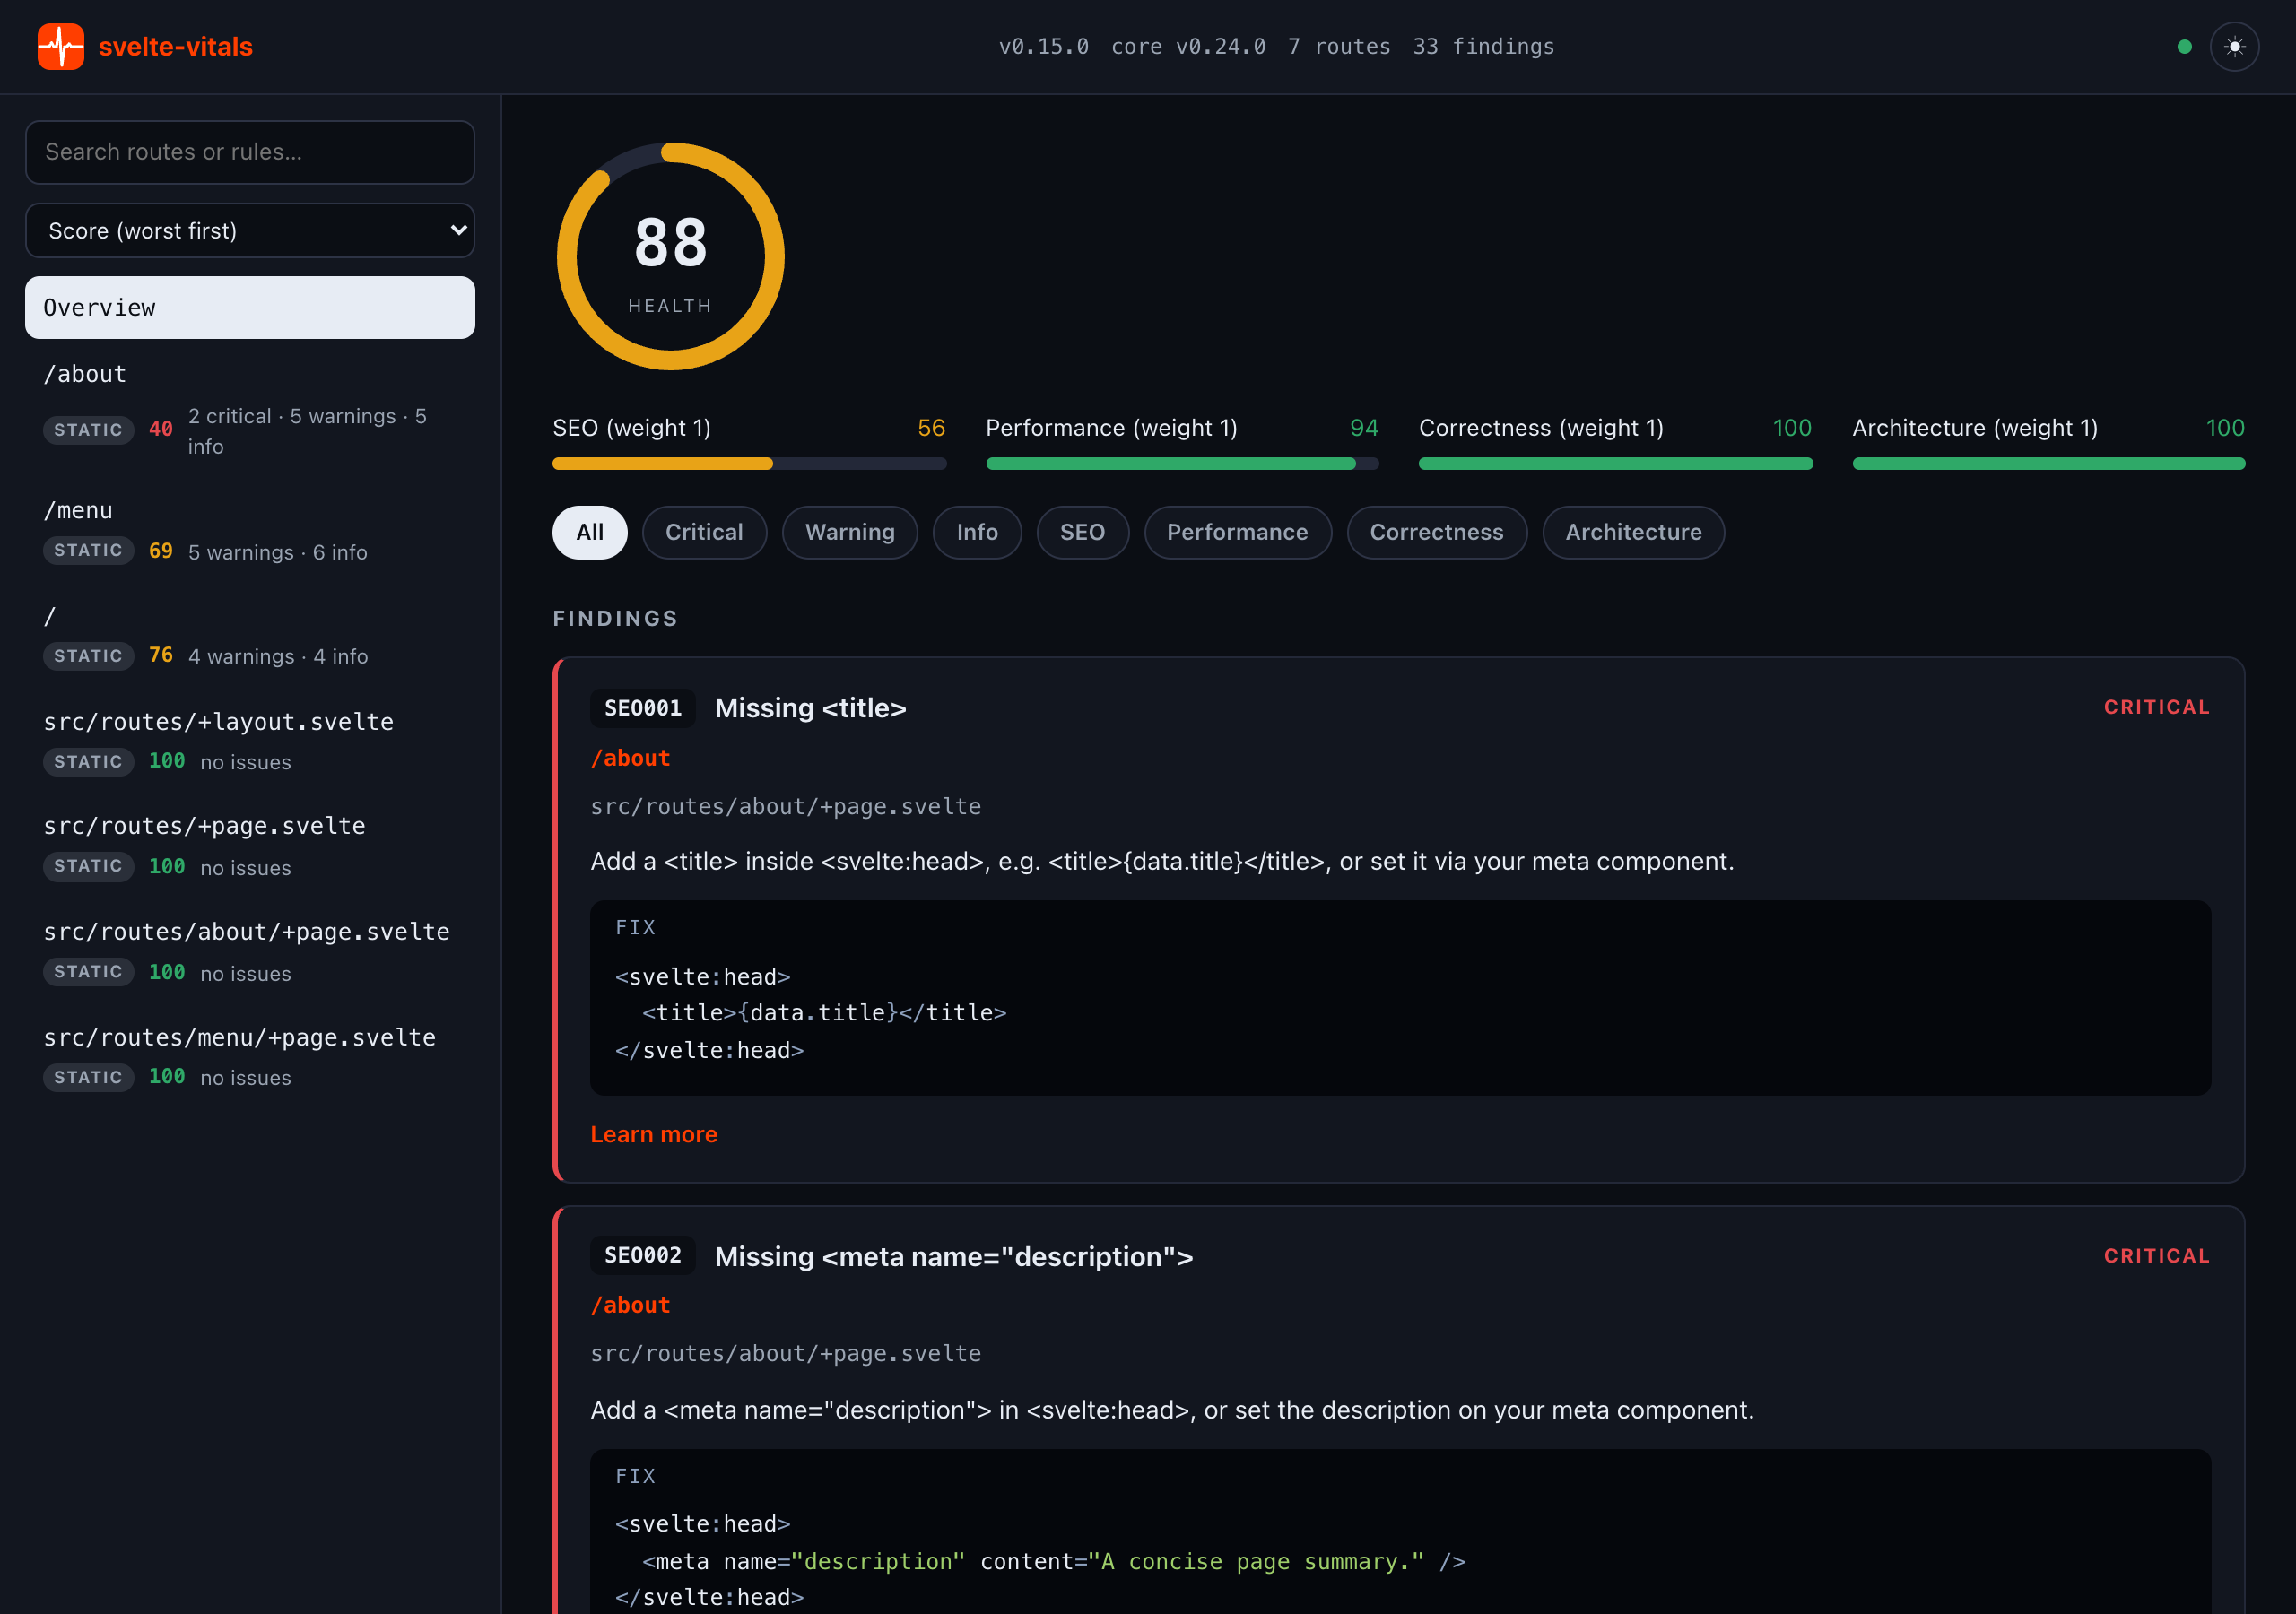
Whole-project coverage from startup
Section titled “Whole-project coverage from startup”From the moment the dev server starts, the dashboard shows the whole project: a static analysis of all routes across every category (SEO, Performance, Correctness, Security, Architecture) runs asynchronously at startup — the same analysis as npx svelte-vitals@latest — so you get the real project Health without visiting a single page. Saving a source file (anything under src/ or static/, or a svelte.config.* / svelte-vitals.config.*) triggers a debounced re-analysis, and the dashboard refreshes itself.
“Overview” lists every finding across the whole project — every route plus the project’s site-wide checks — in one place, and the severity/category chips filter that list directly. Each finding shows which route it came from; clicking it jumps straight to that route’s detail pane.
The sidebar’s search box filters routes by path or by a finding’s rule id/title/location; the sort control reorders it (worst score first by default). Selecting a route (or “Overview”) updates the detail pane and is reflected in the URL hash, so a reload or a shared link returns to the same view. The topbar shows an “Analyzing…” indicator while a whole-project re-analysis is running, plus a dark-mode toggle — the preference is remembered per browser and otherwise follows your OS setting.
If the whole-project analysis fails (for example the dev server root is not a SvelteKit project), the failure is logged with console.warn and the dashboard falls back to live-only mode — showing just the routes you visit — without ever breaking the dev server.
Improve accuracy by browsing
Section titled “Improve accuracy by browsing”On top of that static baseline, browsing your app refines the picture. Add the svelteVitalsHandle hook to src/hooks.server.ts:
import { svelteVitalsHandle } from '@svelte-vitals/vite/hooks';import { sequence } from '@sveltejs/kit/hooks';
export const handle = sequence(svelteVitalsHandle());
If you already have other handles, place svelteVitalsHandle() alongside them inside sequence.
svelteVitalsHandle uses SvelteKit’s transformPageChunk to observe each request’s fully-rendered <head>, fire-and-forget — it never modifies or delays the response, and swallows its own errors, so it can never break the dev server. Each visited route’s rendered results replace the static ones for that route in the dashboard — a rendered page is closer to the truth, especially for dynamic values. Route headings carry a provenance badge: measured for routes whose findings come from a real rendered page, static for routes covered only by source analysis so far.
The handle is a no-op outside dev: the DEV flag from esm-env resolves statically at build time, so the rule set is never built and the hook adds zero runtime cost in production.
svelteVitalsHandle accepts an optional options object:
| Option | Type | Description |
|---|---|---|
metaComponents |
string[] |
Component names treated as head-metadata sources |
rules |
Record<string, RuleSetting> |
Per-rule overrides, e.g. { SEO008: 'off' } |
Example:
export const handle = sequence( svelteVitalsHandle({ metaComponents: ['SeoHead'], rules: { SEO008: 'off' } }));Notes:
- Only the rendered HTML
<head>is analyzed — the same data the browser receives. Source-level dynamic values (e.g.{data.title}) are always resolved by the time the handle sees them, sotreatDynamicAsis not applicable here. failOnis not used: the handle feeds the dashboard but never gates the request.- Live updates only flow over a loopback origin (
localhost,127.0.0.1,[::1]). When you runvite dev --hostand open the app via a LAN IP, the handle skips the ingest POST (a guard against a spoofedHostheader), so visited routes won’t refine tomeasured— open it fromlocalhostinstead. - Set
SVELTE_VITALS_DEBUG=trueto surface swallowed internal errors (analysis failures, skipped ingests) to the terminal for troubleshooting.
Copy a fix prompt for any finding
Section titled “Copy a fix prompt for any finding”Every finding card has a collapsed AI Prompt disclosure — expand it and hit Copy to get a ready-to-paste prompt for whichever coding agent you’re using, built from that finding’s rule id, location, recommendation, fix, and docs link:
Fix this svelte-vitals finding:
- Rule: SEO001 — Missing <title> (critical)- Route: /blog/hello- Location: src/routes/blog/hello/+page.svelte:3- Recommendation: Add a <title> inside <svelte:head>.- Fix: Add a <title> tag.
```svelte<svelte:head>  <title>Hello</title></svelte:head>```
- Docs: https://oekazuma.github.io/svelte-vitals/rules/seo001
After fixing, re-run `svelte-vitals --diff` (or revisit this route) to confirm SEO001 passes for /blog/hello.
No AI call generates it — the prompt is assembled instantly from svelte-vitals’ own rule data already in the dashboard’s snapshot, the same fields the agent reporter uses for its remediation document. It can’t hallucinate a fix that isn’t the rule’s actual recommendation.
Disabling it
Section titled “Disabling it”The dashboard is on by default. If you only want the build-time gate and not the dev-time dashboard — for example on a very large project where you’d rather avoid the startup/re-analysis cost — pass ui: false:
export default { plugins: [svelteVitals({ ui: false })]};Version drift
Section titled “Version drift”The dashboard topbar shows v<@svelte-vitals/vite version> and, next to it, core v<@svelte-vitals/core version>. That second number is the one that matters when comparing findings against the CLI: svelte-vitals (CLI) and @svelte-vitals/vite are versioned independently, both wrapping the shared @svelte-vitals/core rule engine — so it’s possible for the two to resolve to different core versions even when both packages themselves look up to date, and a rule added in a newer core release will only show up on whichever surface actually depends on it.
This is easy to hit without noticing through package-manager cooldown/pinning features — e.g. pnpm’s minimumReleaseAge can silently resolve a pnpm dlx svelte-vitals@latest run down to an older “mature” release (with an older core) than what @svelte-vitals/vite in your lockfile depends on. If the CLI and the dashboard disagree on findings for the same project, run svelte-vitals --version and compare its (core X.Y.Z) against the dashboard topbar’s core vX.Y.Z — a mismatch there is the first thing to check before assuming a bug.